
Yesterday, we were able to complete the annotation of the training set, consisting of three scanners (Hamamatsu XR, Hamamatsu S360 and Aperio CS2). A big thank you goes out to our pathologists (Christof Bertram, Taryn Donovan, Robert Klopfleisch) for being that responsive and quick – it’s an awesome team effort!
The training set consists of 150 annotated images (50 per scanner) of human breast tissue, and 50 non-annotated images of another scanner (200 images, corresponding to 200 cases).
Case selection and ROI definition
We wanted to be absolutely sure to give you a high quality and well-balanced data set that is representative and as bias-free as possible. For this reason, all cases were retrieved from the same pathology lab (UMC Utrecht, a big thank you to Natalie and Nikolas for all your work!) and feature a standardized staining and tissue processing workflow.
In an attempt to make the data set representative, we included all cases consecutively that fulfilled our inclusion criteria. This results in a slightly lower mitotic count per area compared what you might find in other data sets, but it reflects the realistic distribution in a major university medical center.
All slides were handled uniformly for ROI selection, which was performed by a single trained pathologist on the whole slide images of all ~300 cases (training + test set) prior to annotation. As defined by the grading scheme, the pathologist tried to find the area of highest mitotic activity for this. We then digitized the slides with the other scanners, registered them and transformed the ROI to the respective coordinates on the other scanners.
After that, we cropped the ROI from the secondary WSI and stored them in TIFF format. These crop-outs will be made available to the challenge participants.
Annotation
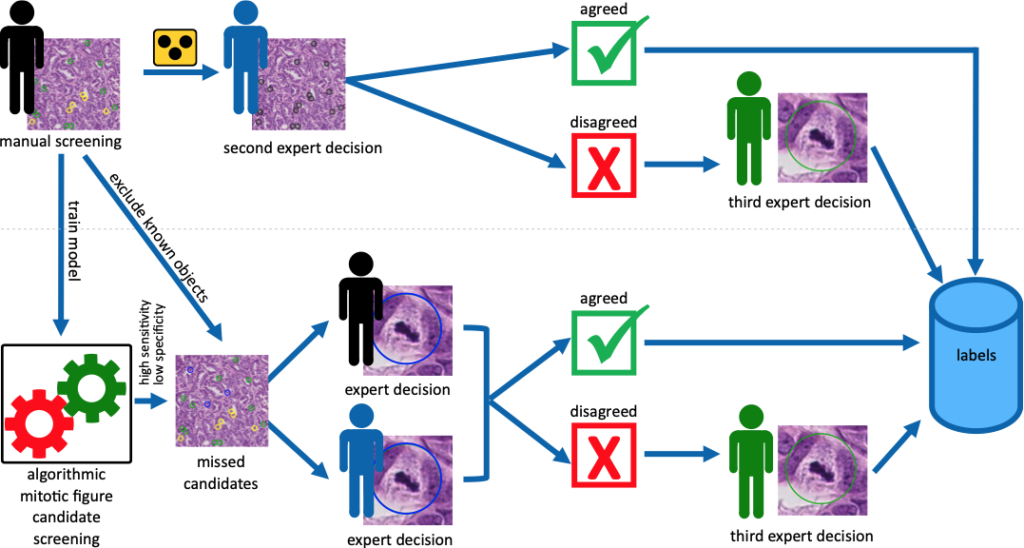
Following our usual annotation procedure, our primary pathologist screened all images for mitotic figures and similarly looking cells (imposters / non-mitotic figures). With these annotations, we ran a RetinaNet-based object detection pipeline to find potentially overlooked cases of mitosis, which would then be judged again by the pathologist. In all three sets (corresponding to the three scanners), this accounted for an increase in mitoses of about 10%. All mitosis candidates (the mitotic figures and the imposters) were then presented blinded to another pathologist, who would render a secondary decision. In case of agreement, the label is added to the data set. In case of disagreement, a third expert was asked to render the final decision.
Details about the training data set can now be found on the dataset page.
Leave a Reply