Digital pathology is a fast-growing field that has seen strong scientific advances in recent years. Especially the accurate diagnosis and prognosis of tumors is a topic of particular interest, as documented by recent challenges on MICCAI, ICPR and elsewhere. In this context, the detection of cells undergoing division (mitotic figures) in histological tumor images receives high attention. The density of mitotic figures (mitotic count) is known to be related to tumor proliferation and is thus highly relevant for the prognostication. It is one of the most relevant parameters used for decision of appropriate therapy. The current gold standard method is visual assessment by a trained pathologist.
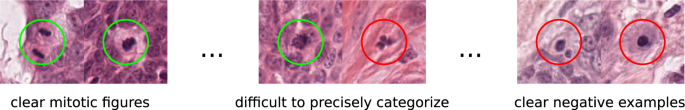
The morphology of mitotic figures strongly overlaps with similarly looking imposters. Therefore, the mitotic count is notorious for having a high inter-rater variability, which can severely impact prognostic accuracy and reproducibility. This calls for computer-augmented methods to help pathology experts in rendering a highly consistent and accurate assessment.
While previous competitions focused on the detection of mitotic figures in small sections of H&E-stained tumor tissue (e.g., the ICPR 2012 and AMIDA challenges), more recent studies moved closer to a realistic diagnostic workflow by targeting the prediction of tumor behavior on microscopy whole slide images (WSI) (e.g., the CAMELYON16/17 challenges, the PANDA challenge and MICCAI-TUPAC 16 challenge). Recent studies have shown that given a sufficient amount of high quality and high quantity annotations for tumor specimens, current deep learning-based approaches can yield performance comparable to well-trained human experts for mitotic figure identification. However, this performance severely degrades with the variability of images, caused by the tissue preparation and image acquisition.
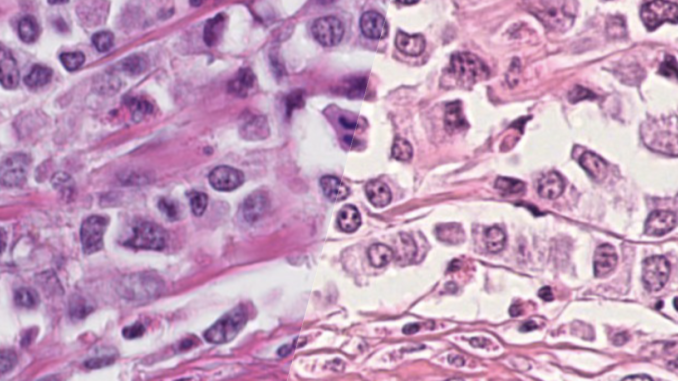
This so-called domain-shift is inevitable to some degree even for the same highly standardized laboratory due to differences in tissue handling and manual steps in specimen preparation; however is especially notable between different laboratories. Probably the most important source of a domain shift is the whole slide image acquisition due to highly variable color representation and other image parameters between different types of whole slide scanners. Therefore, naively applying machine learning algorithms developed using images from one laboratory may lead to low performance at another laboratory. For this challenge, we digitized microscopy slides from 300 cases of suspected breast cancer at different laboratories, using six different scanner types. The target of this challenge is thus to develop strategies that lead to machine learning solutions that are invariant to this domain-shift, and work equally well, regardless of the scanner that was used for the image digitization.
The topic of this challenge is thus highly relevant in order to promote machine learning-based algorithms to a routine and widespread diagnostic use across laboratories. It will be the first challenge in the field of histopathology to compare methods of domain adaptation on a competitive, large-scale dataset from multiple tissue types and clinical environments. We also expect the results to deliver insights into domain generalization approaches on microscopy images in general.
How is it evaluated?
The common metric for evaluation mitotic figure detections is the F1 score. The main reason why we will not be using non-threshold based metrics like mAP is that the perfect detection threshold may vary strongly with the domain, so participants need to optimize a (scanner-agnostic) detection threshold.
The F1 metric accounts for false positives as well as false negatives and is thus a fair metric. As some images might have only a small number (or even none at all) mitotic figures (in low grade tumors), we calculate the F1 score over the complete data set by counting all true positives (TP), false positives (FP), and false negatives (FN) and calculate:
